Saturday, December 18, 2010

Table of critical values

Many of you didn't copy the appendix containing the table of critical values in Bartz's book. I have scanned the tables containing critical values of Pearson r, Spearman r and t. Here they are. Just click on the pictures below to have larger view.

Pearson r


Spearman r


t value

Wednesday, December 15, 2010

Difference between means

A teacher teaches pronunciation using several techniques such as drills and songs. She may wonder which technique is more effective, drills or songs. To find out which one is more effective, she needs to conduct experimental research. In this research she asks the following research question:

Is there a difference in pronunciation
between students who are taught using songs
and those who are not?

She has two pronunciation classes and assigns them into two groups:

Experimental group --> taught using songs
Control group --> taught without using songs

At the beginning of the semester, she gives both groups a pronunciation test as a pretest. Then she teaches them pronunciation for one semester. At the end of the semester, she gives them the same pronunciation test as a posttest. The results of the posttest are compared. If the mean of the experimental group is higher than the mean of the control group, she can conclude that using songs is a more effective technique than drills only.

The following table summarises the design of the research.


The teacher can find out whether the difference is significant or not by computing the t value using t-test formula. If her t value is higher than the t value in the table, the difference is significant. However, if her t value is lower than the t value in the table, the difference is not significant.

Saturday, December 4, 2010

Correlation

Correlation indicates the relationship between two variables. If you ask such questions as:
  • Is there a relationship between writing ability and grammar competence?
  • Is there a relationship between reading ability and vocabulary size?
...actually you want to know whether the two variables (writing ability & grammar competence, reading ability & vocabulary size) are correlated. You could get the answers to these questions by drawing a scattergram or computing the correlation coefficient.

Scattergram

A scattergram is a graph which shows the relationship between two variables. If you have two sets of data in the form of scores and plot them in the graph, it will look like the following:


The dots form an oval which leans to the right. It means there's a positive, high relationship between the two variables. If, however, the dots form an oval which leans to the left, there's a negative, high relationship between the variables.


The problem with scattergram is the ambiguity in interpreting the strength of the correlation. How high is high? And how low is low? To get a precise results, it is better to use statistical formulas.

Formulas

There are two formulas that you can use to compute the correlation coefficient.
  1. Pearson Product Moment. Use this formula if you have two sets of data which are interval or ratio.
  2. Spearman Rank. Use this formula if you have two sets of data which are different types, eg. interval and nominal. Convert both sets of data into ordinal by changing the interval/ratio/nominal numbers into ranks.

Wednesday, October 27, 2010

Assignment

A language teacher obtained the following scores after giving the students an English test.

5 9 7 7 9 8 5 8 9 9 9 7 6 6 7 6 7 8 7 9

Please compute the mean and interpret the results (what does the mean mean?).

Saturday, October 23, 2010

Variability

Variability shows how scores vary in a distribution. There are several ways of estimating the variability of scores, but as a language teacher you need to know only two of them: range and standard deviation.

Range
It simply means the difference between the highest score and the lowest score. In the formula, you have to add 1 because you have to take into account the upper limit of the highest score (0.5) and the lower limit of the lowest score (0.5).

Range = H - L + 1


Standard deviation
Standard deviation shows how far a particular score deviates (moves away) from the mean. You can compute standard deviation by using the following formula:


The smaller the standard deviation, the more homogeneous the group of scores is. The larger the standard deviation, the more heterogeneous it is.

Central Tendency

There are three methods of measuring central tendency. I believe you are familiar with all of them as you learned about them in primary school.

Mode
Mode simply means the number which occurs most frequently. For example, you have the following scores:

9 9 8 8 7 7 7 6 6 5 5

The mode is 7 because this score occurs three times, while the others only occur twice.

Median
Median is the number which is located exactly in the middle of the distribution. Before determining the median of the distribution, make sure you list the scores from the highest to the lowest. If you have odd number of scores in a distribution, pick the score in the middle. For example:

9 9 8 8 7 7 7 6 6 5 5

There 11 scores in the above distribution. The median is 7.
However, if there are even number of scores in the distribution, pick two scores in the middle, add them and divide the result by 2.

9 9 8 8 8 7 6 6 5 5

There are 10 scores in the above distribution. Pick 8 and 7 which are located in the middle of the distribution. (8 + 7) / 2 = 7.5. The median is 7.5.

Mean
Mean is the average of the scores in a distribution. You compute the mean by dividing the total sum of scores by the number of scores. The formula is:

Thursday, October 21, 2010

Types of Scales

The term scales here simply means numbers. Before you decide the formula you're going to use in statistical analysis, you have to know what kind of numeric data you have. Different type of numbers (numeric data) needs a different formula.

There are 4 types of scales.

Nominal scale
It is used only to label or name something, and can be replaced with letters. It has no numeric value so it cannot be added, subtracted, multiplied or divided. For example:


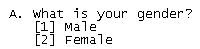
The above question results in numeric data in the form of nominal scale. If the respondent is male, he will answer 1. If the respondent is female, she will answer 2. The numbers 1 and 2 are used to label the respondents on the basis of their gender. We can use options [a] for male and [b] for female instead of numbers.

Ordinal scale
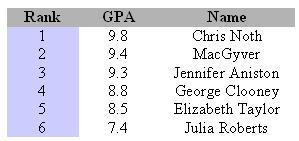
It is used to show ranks. It has no numeric value so it cannot be added, subtracted, multiplied or divided. For example, the following ranks (the blue column) in Class 1A at Mbebekan Elementary School in semester 1 2009/2010 show ordinal scale:


Interval scale
It is used to show numbers which have equal interval between one unit and another. It can be added, subtracted, multiplied or divided. However, it has no absolute zero. The examples are numbers showing temperature and scores.

Ratio scale
Like interval scale, it is used to show numbers which have equal interval between one unit and another. It can be added, subtracted, multiplied or divided. It has absolute zero, so the number 0 indicates nothing or no one. The examples include numbers showing length, height, weight or time.